
Console Library
Browse console profiles.
Browse the published console profiles behind the ranking. Each page explains the sales figure, the source confidence, and the business context that a table row cannot carry on its own.
Published profiles
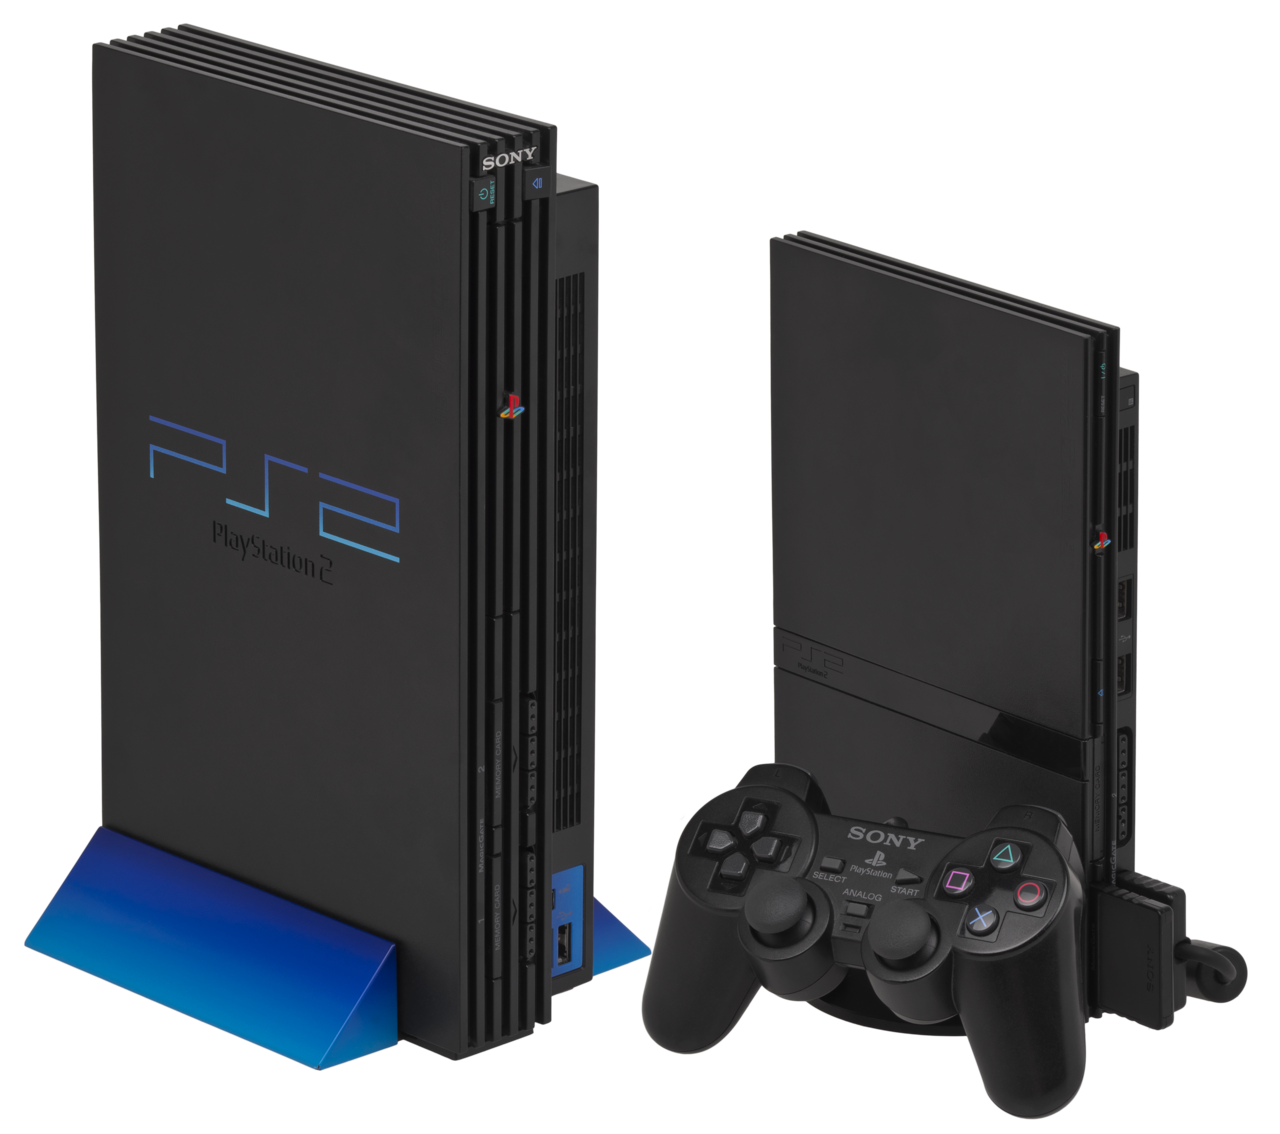
PS2
A look at the best-selling console: DVD timing, a very long retail life, and software support that kept the hardware moving well beyond launch.
Read profile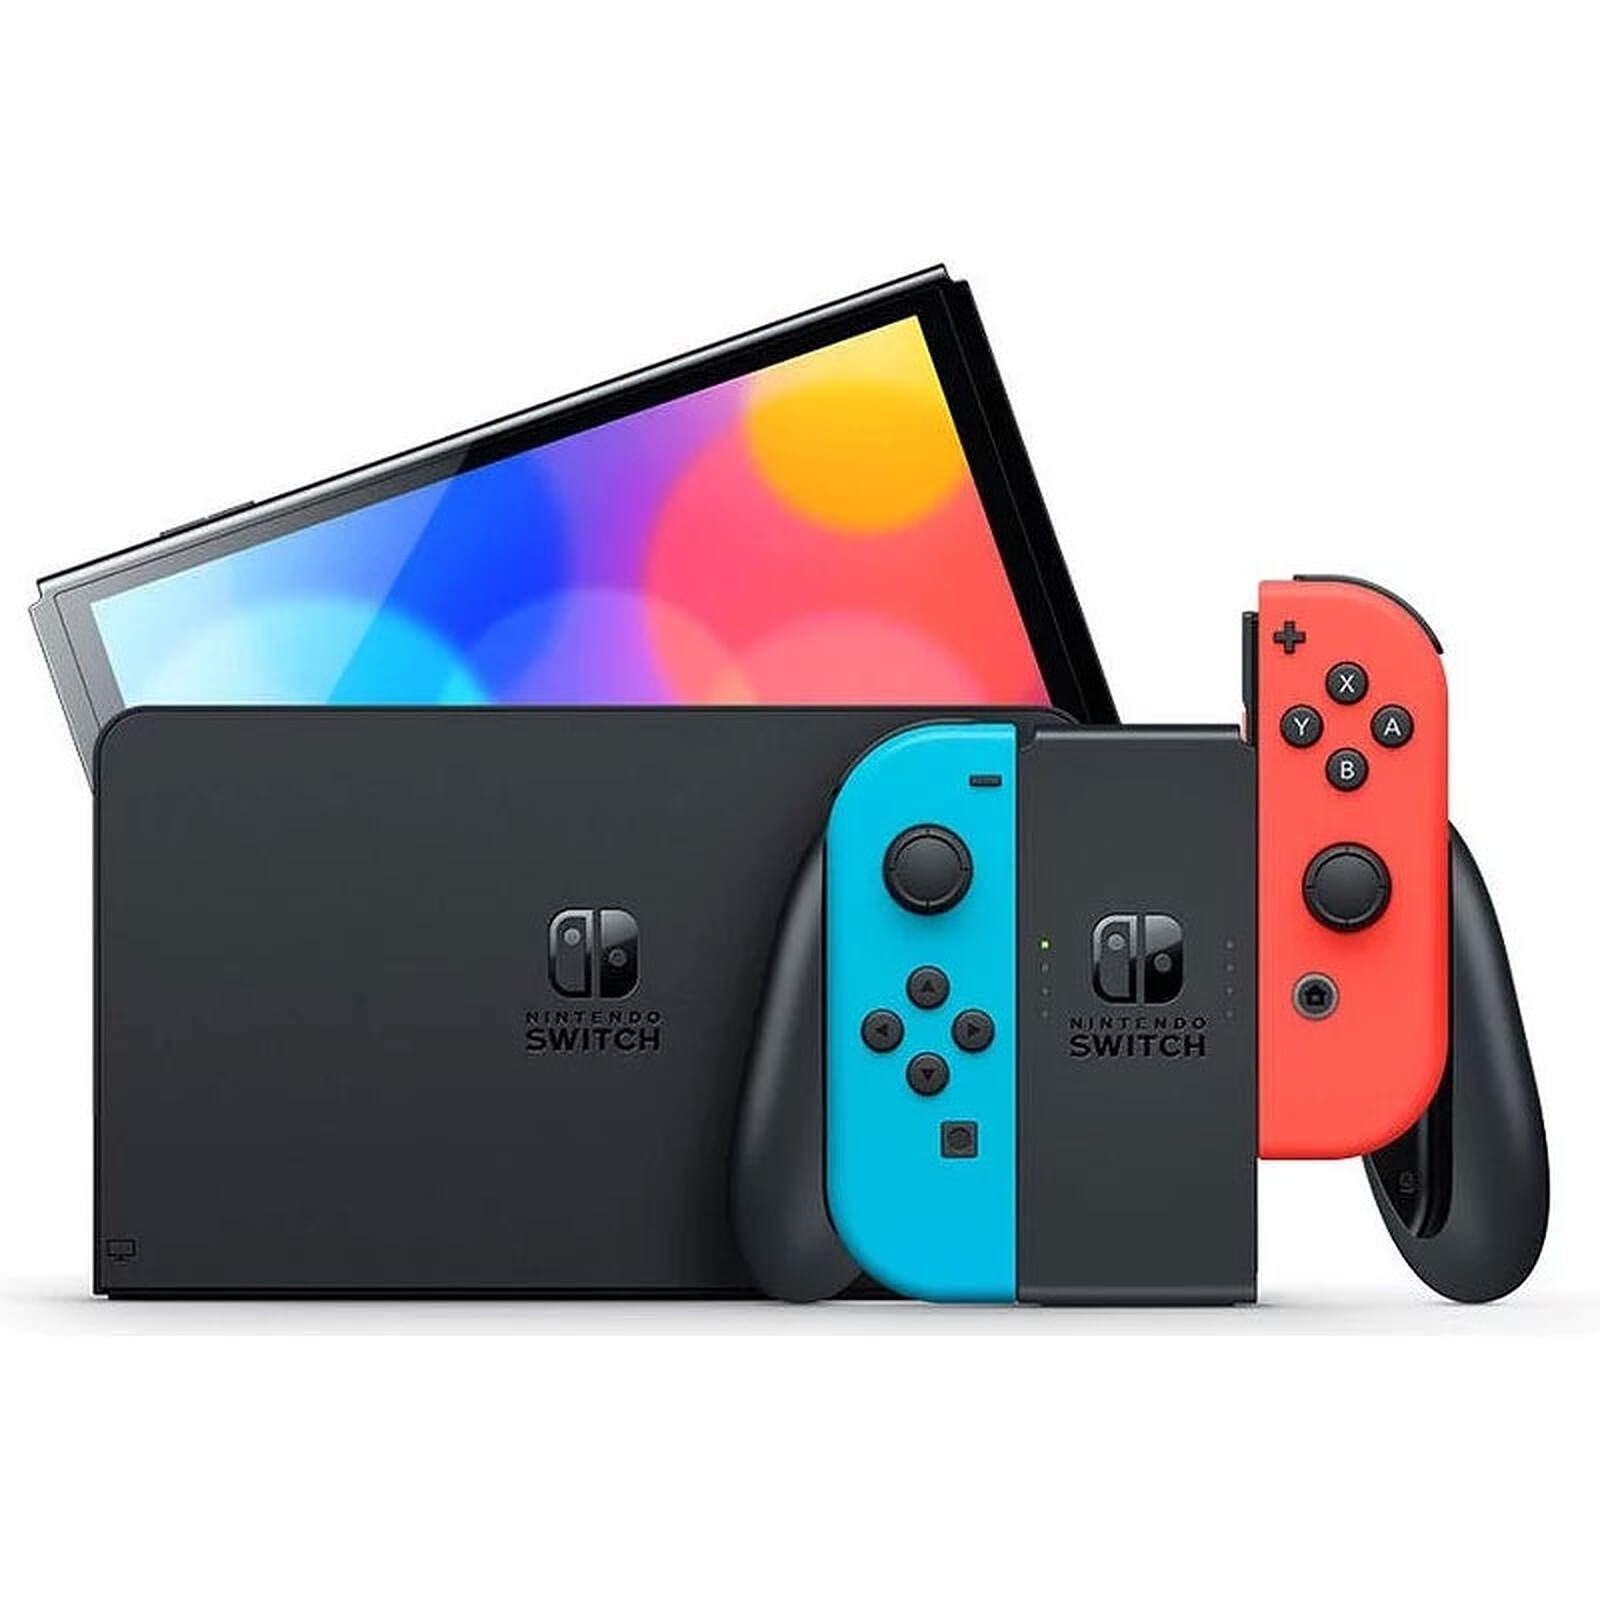
Switch
The hybrid platform whose long commercial tail changed how a current-generation sales race can look on a lifetime chart.
Read profile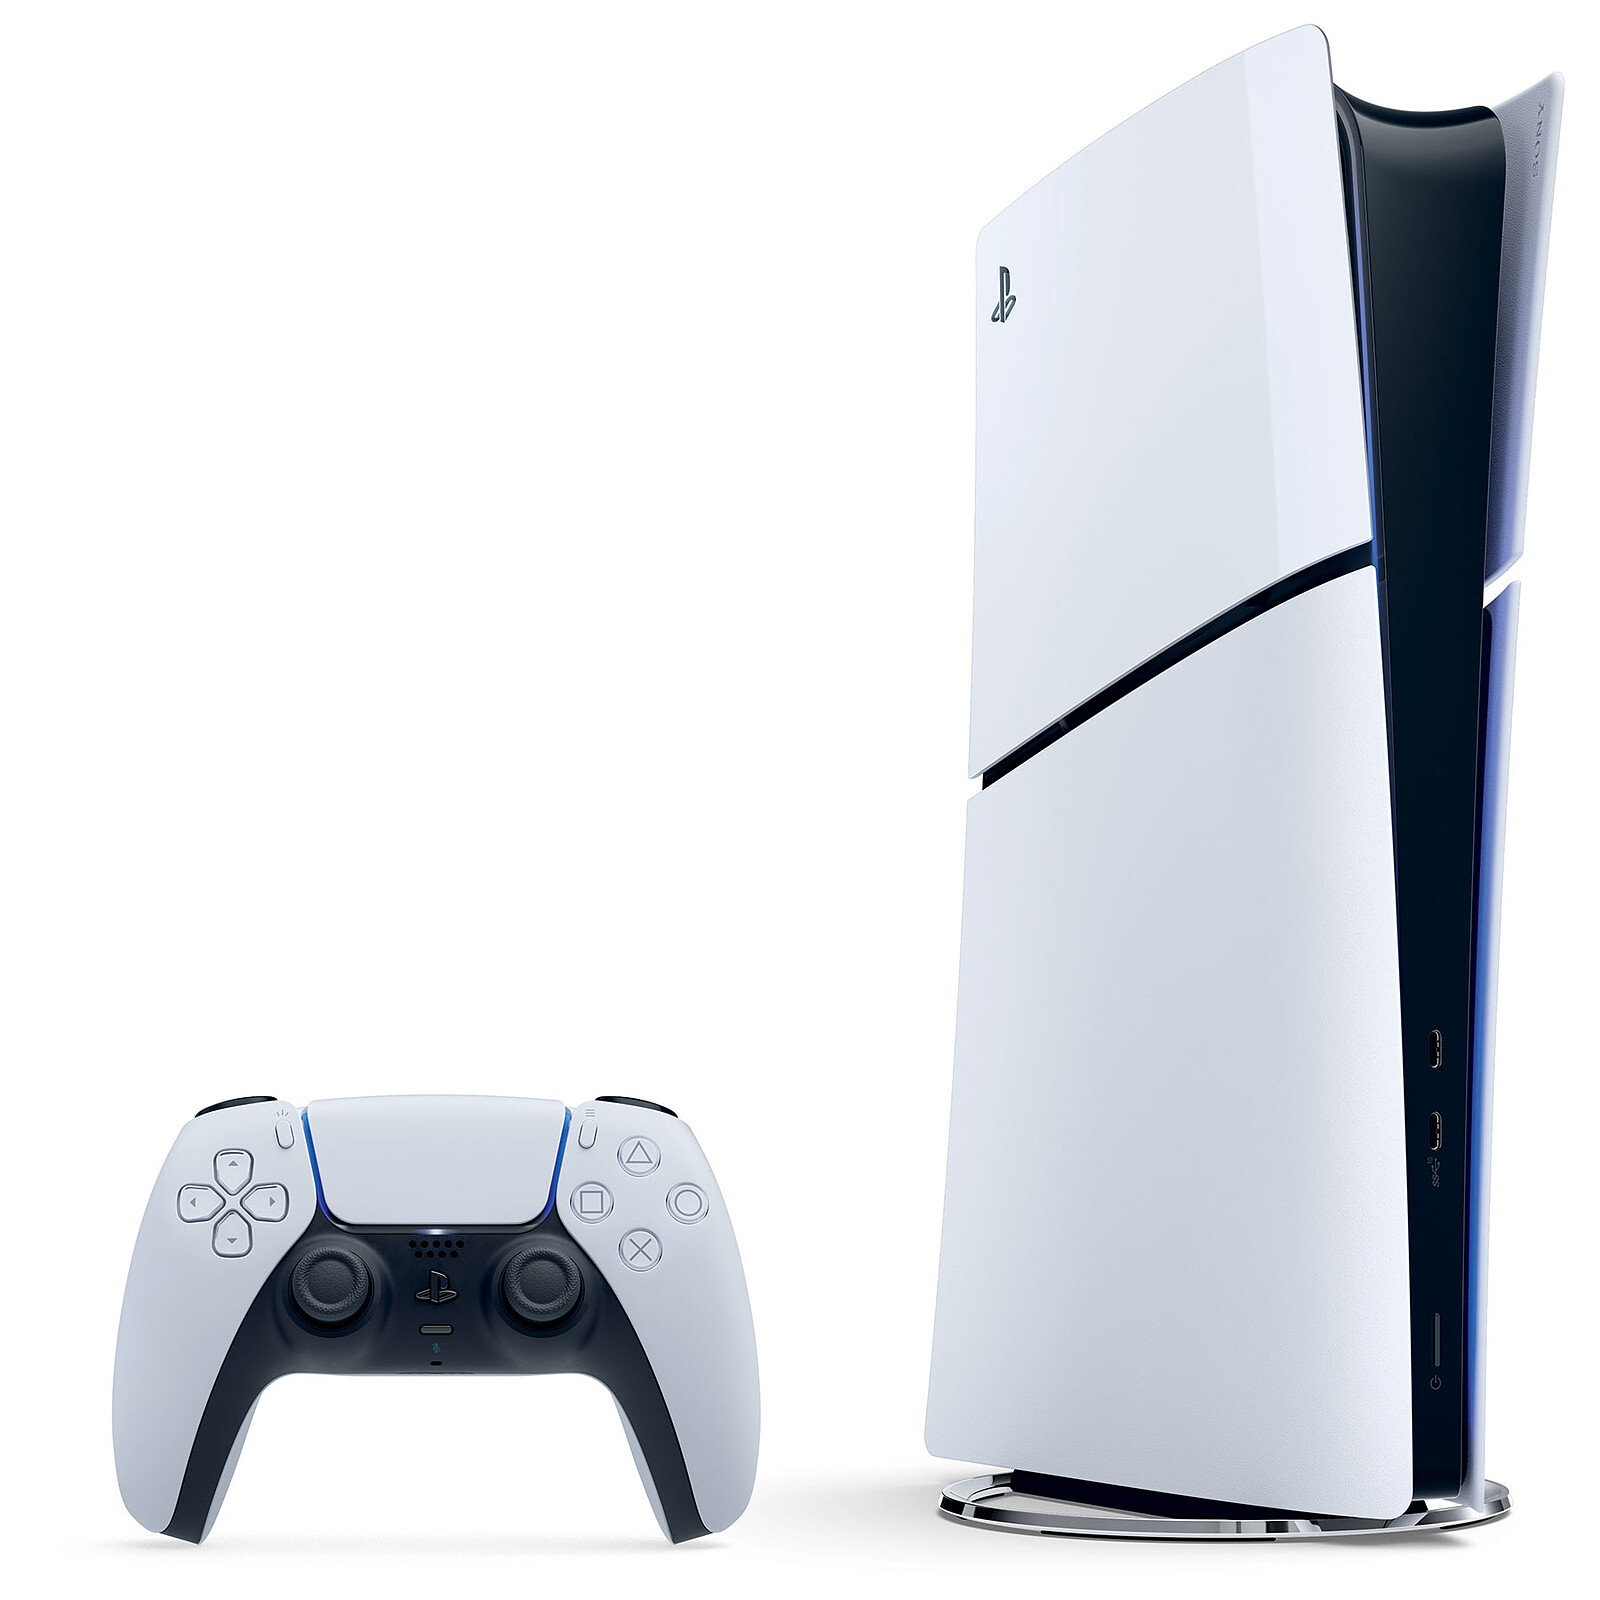
PS5
Supply constraints, recovery, premium pricing, and the modern PlayStation strategy behind Sony’s current flagship.
Read profile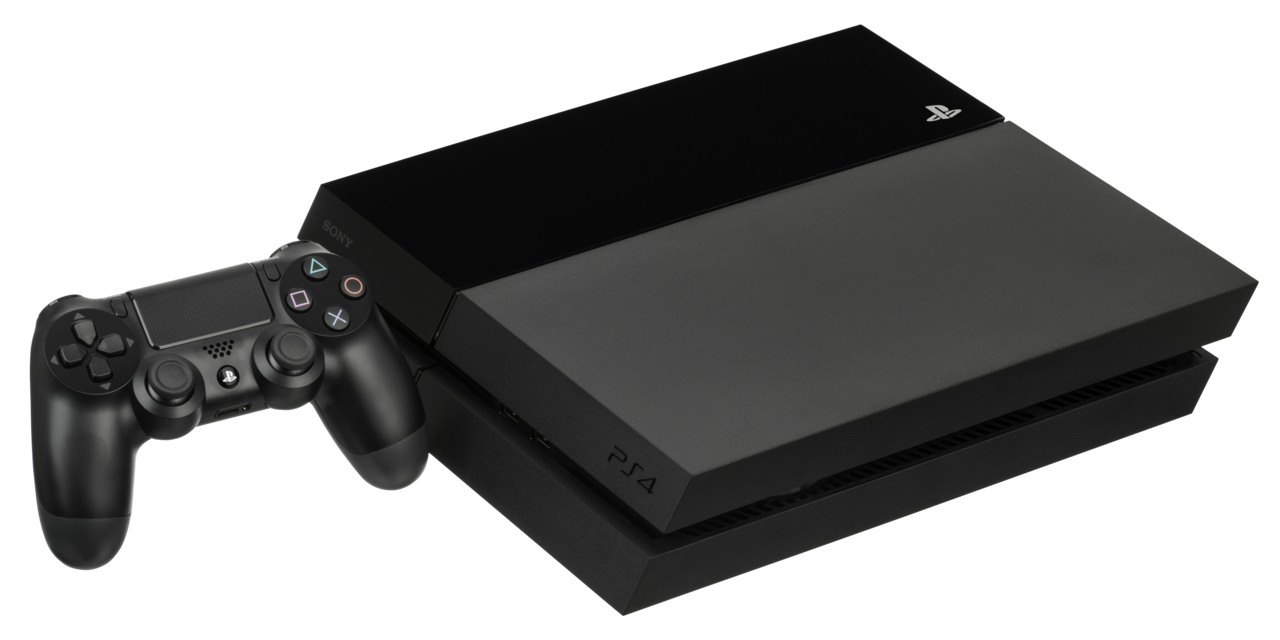
PS4
The machine that defined the eighth generation by staying simple, affordable, and easy for publishers to support.
Read profile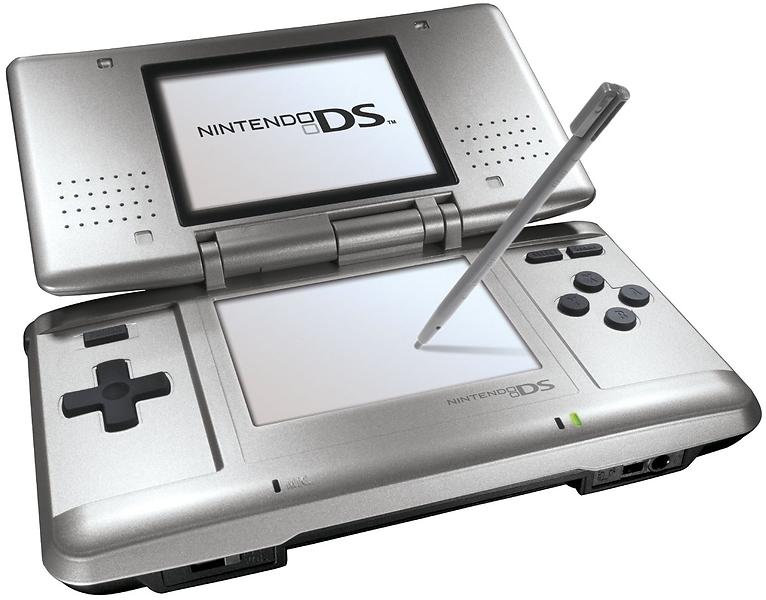
Nintendo DS
A handheld phenomenon powered by broad demographics, touch input, and software that reached far beyond core players.
Read profile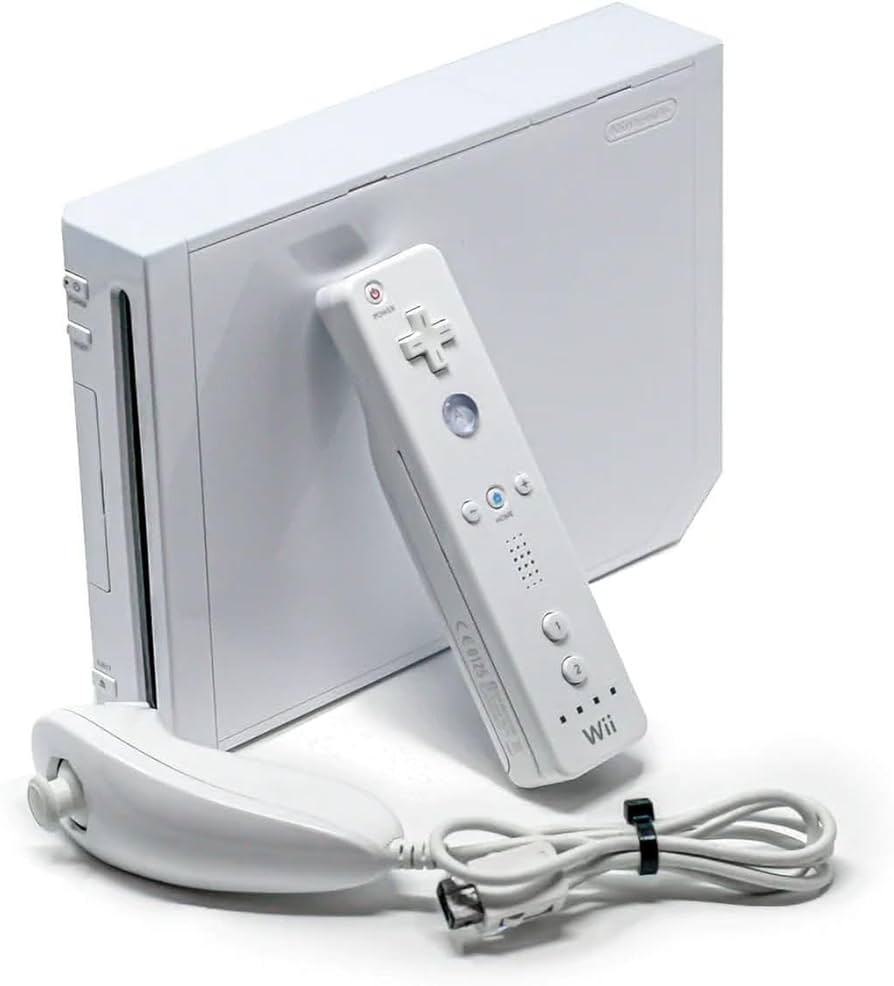
Wii
Motion controls, Blue Ocean strategy, and the gap between cultural ubiquity and long-term platform follow-through.
Read profile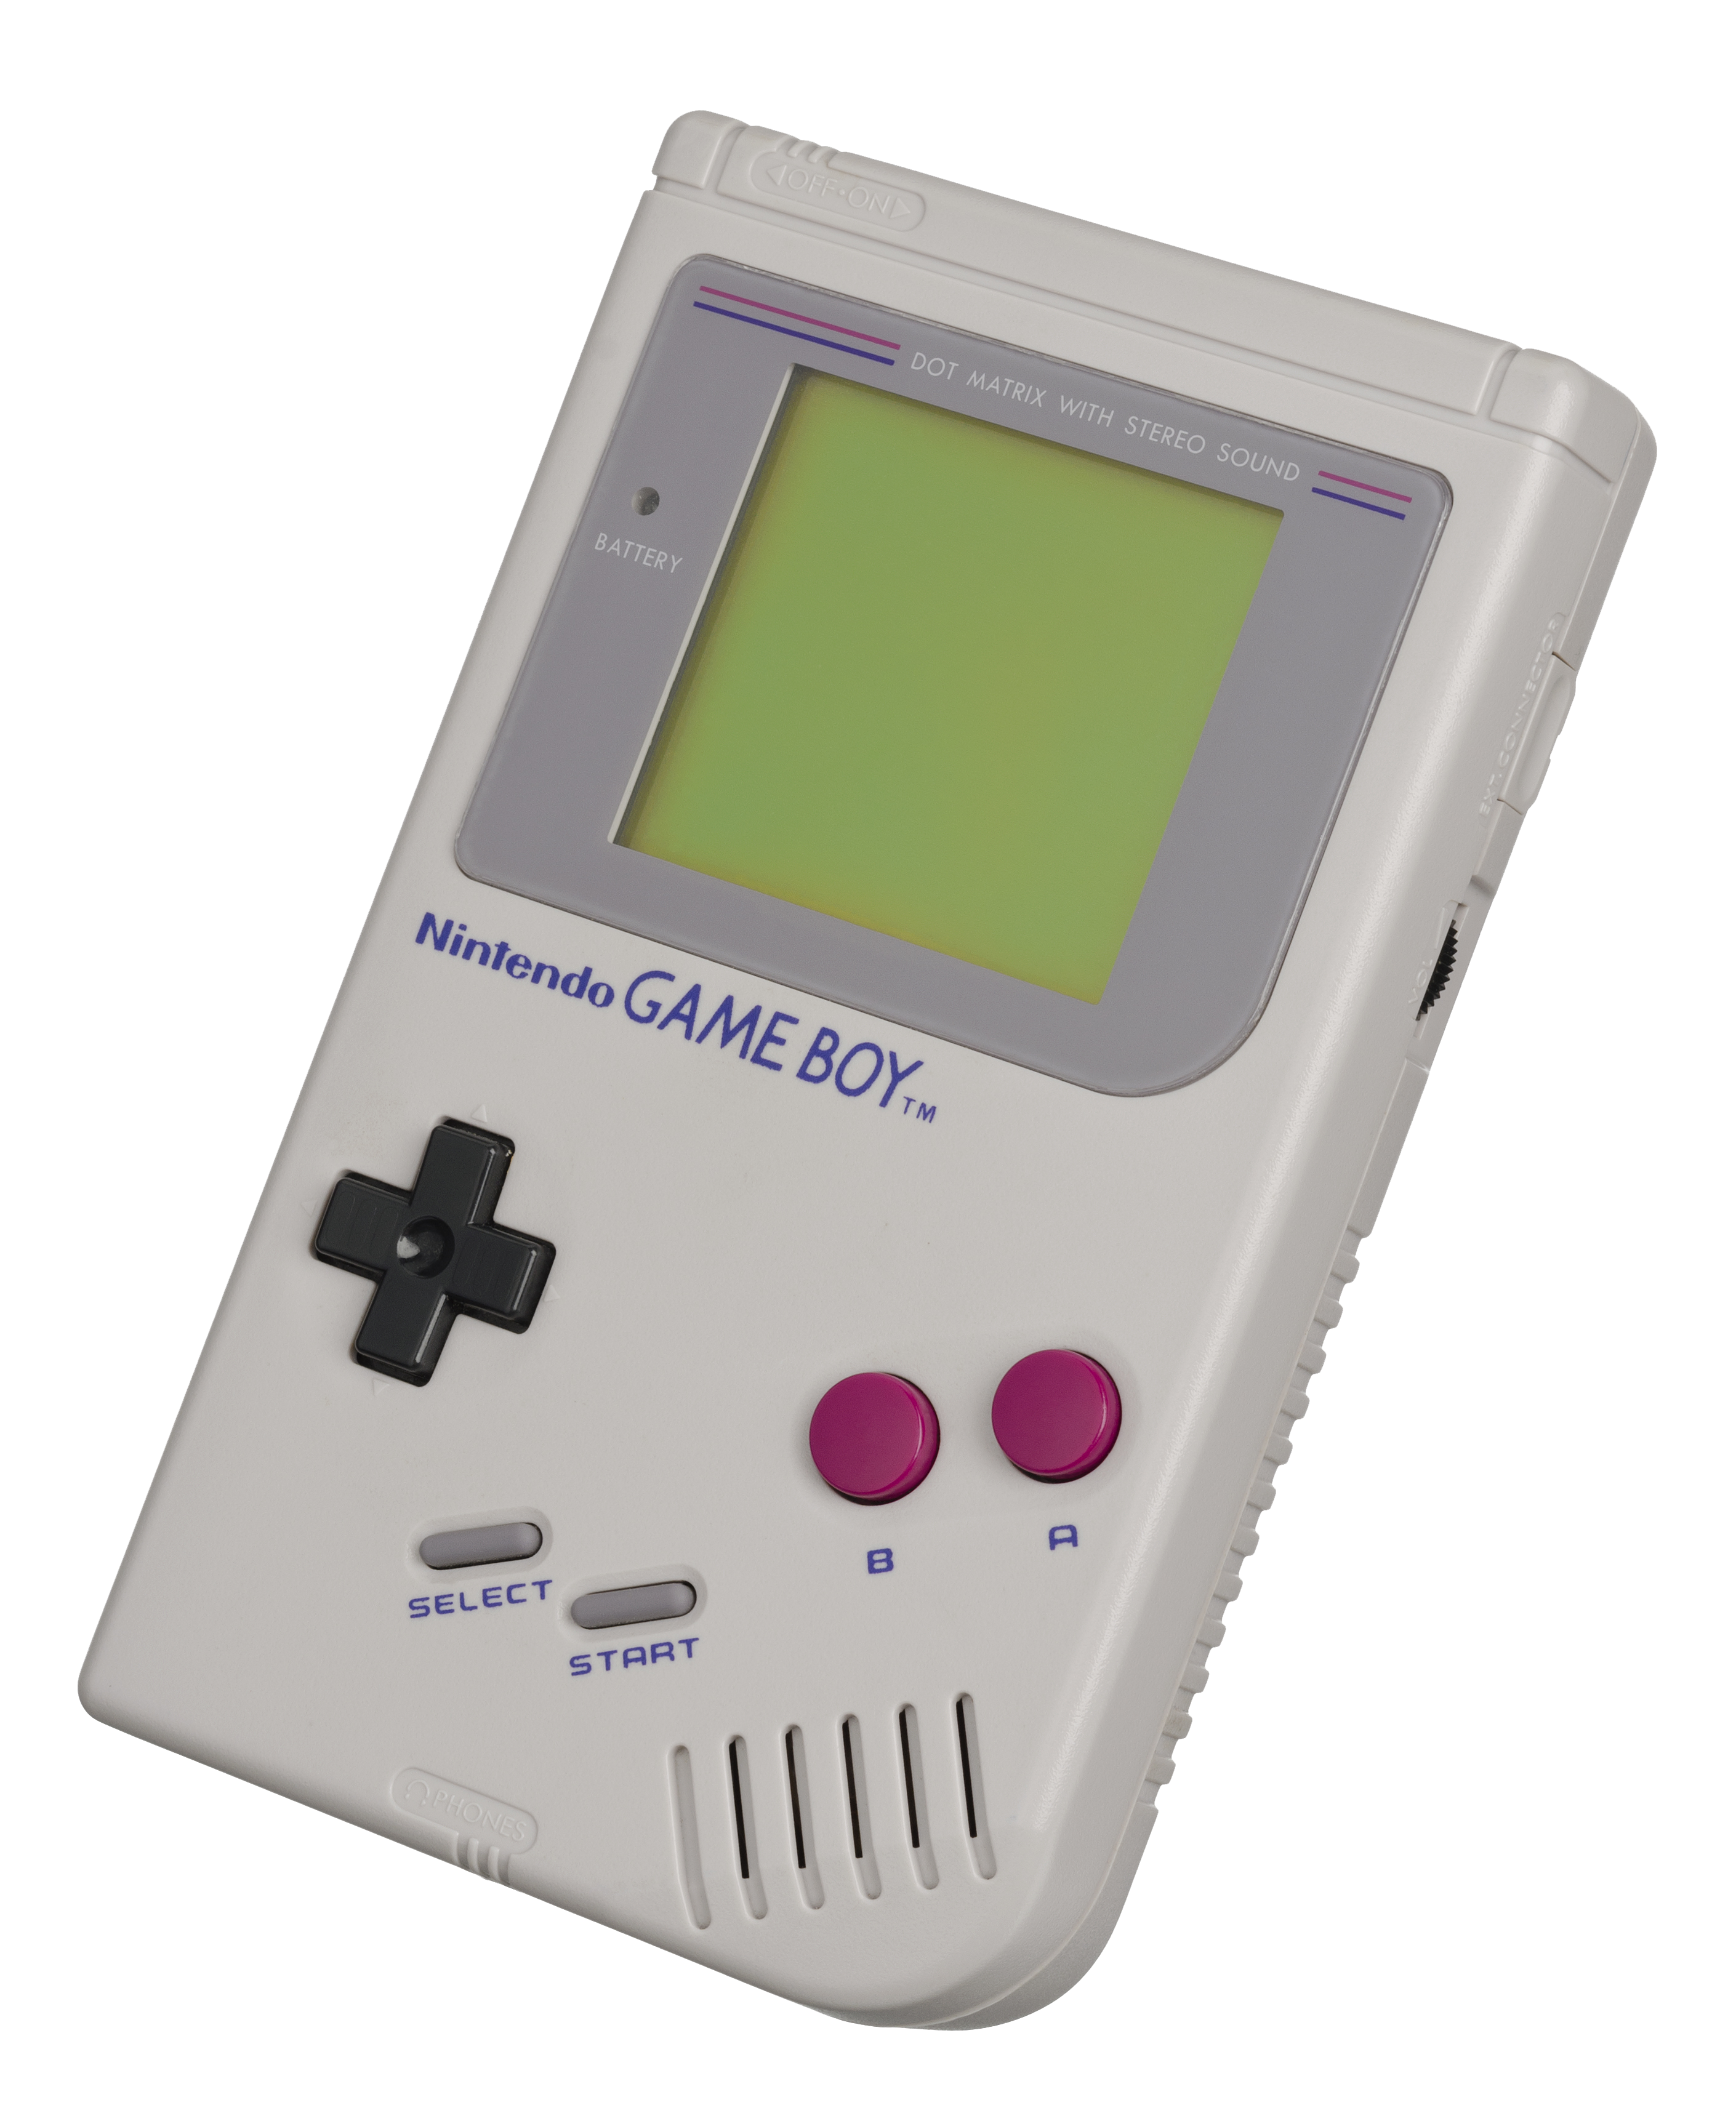
Game Boy
The durable portable line whose reach was shaped by battery life, Pokemon, and years of quiet mainstream momentum.
Read profile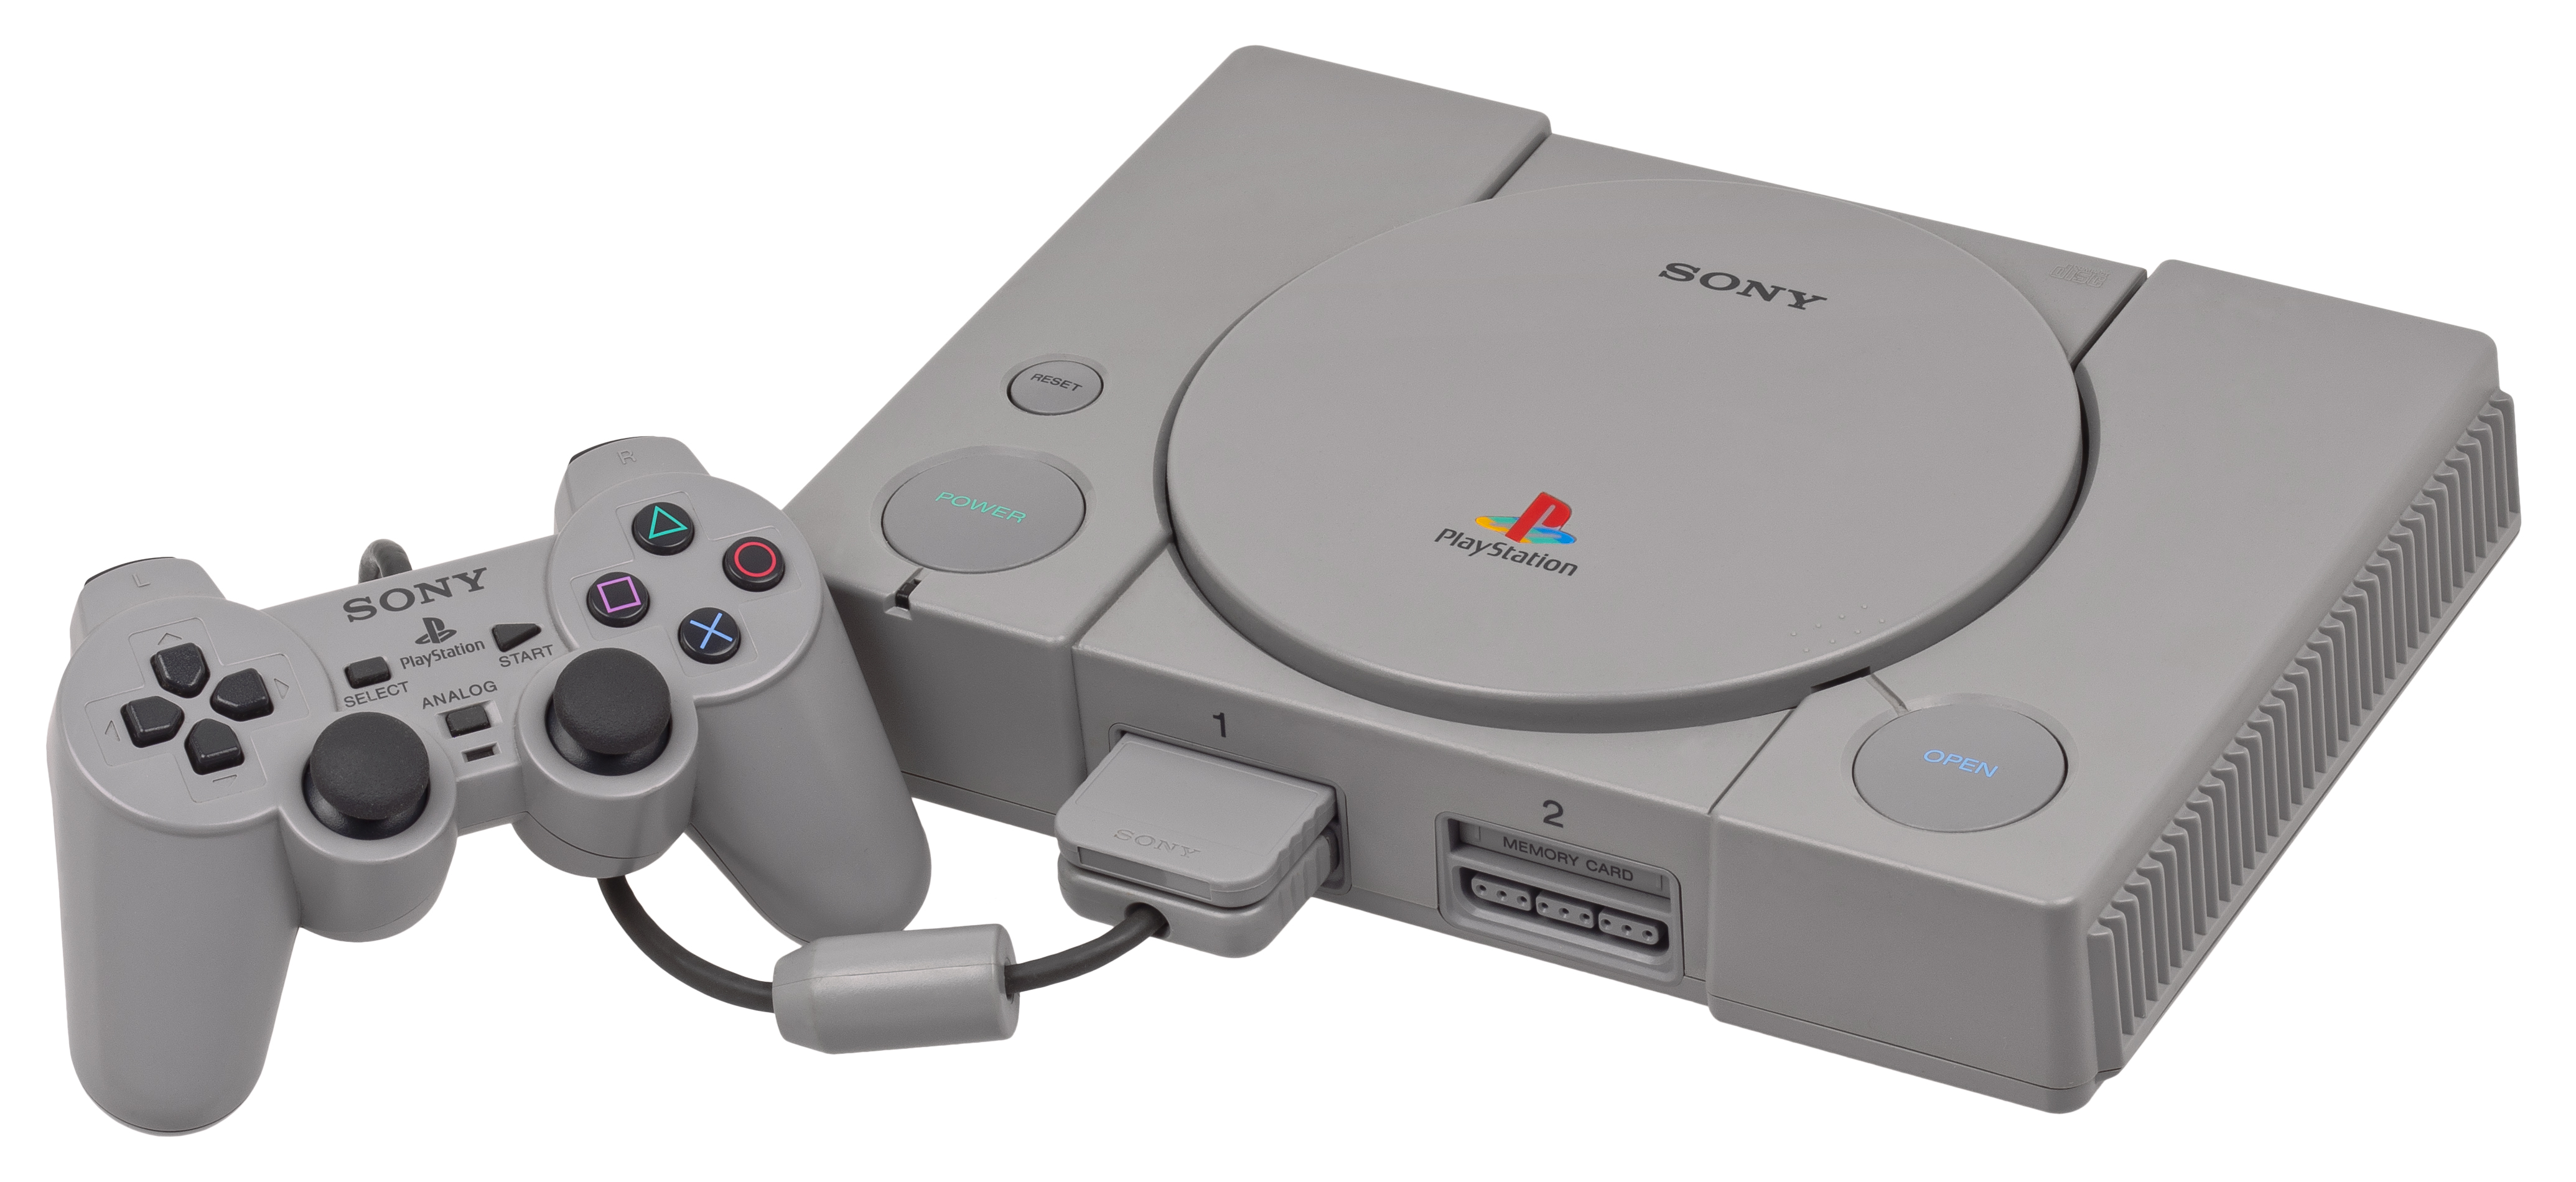
PlayStation
The CD-ROM era breakaway success that made Sony a permanent force in the console business.
Read profile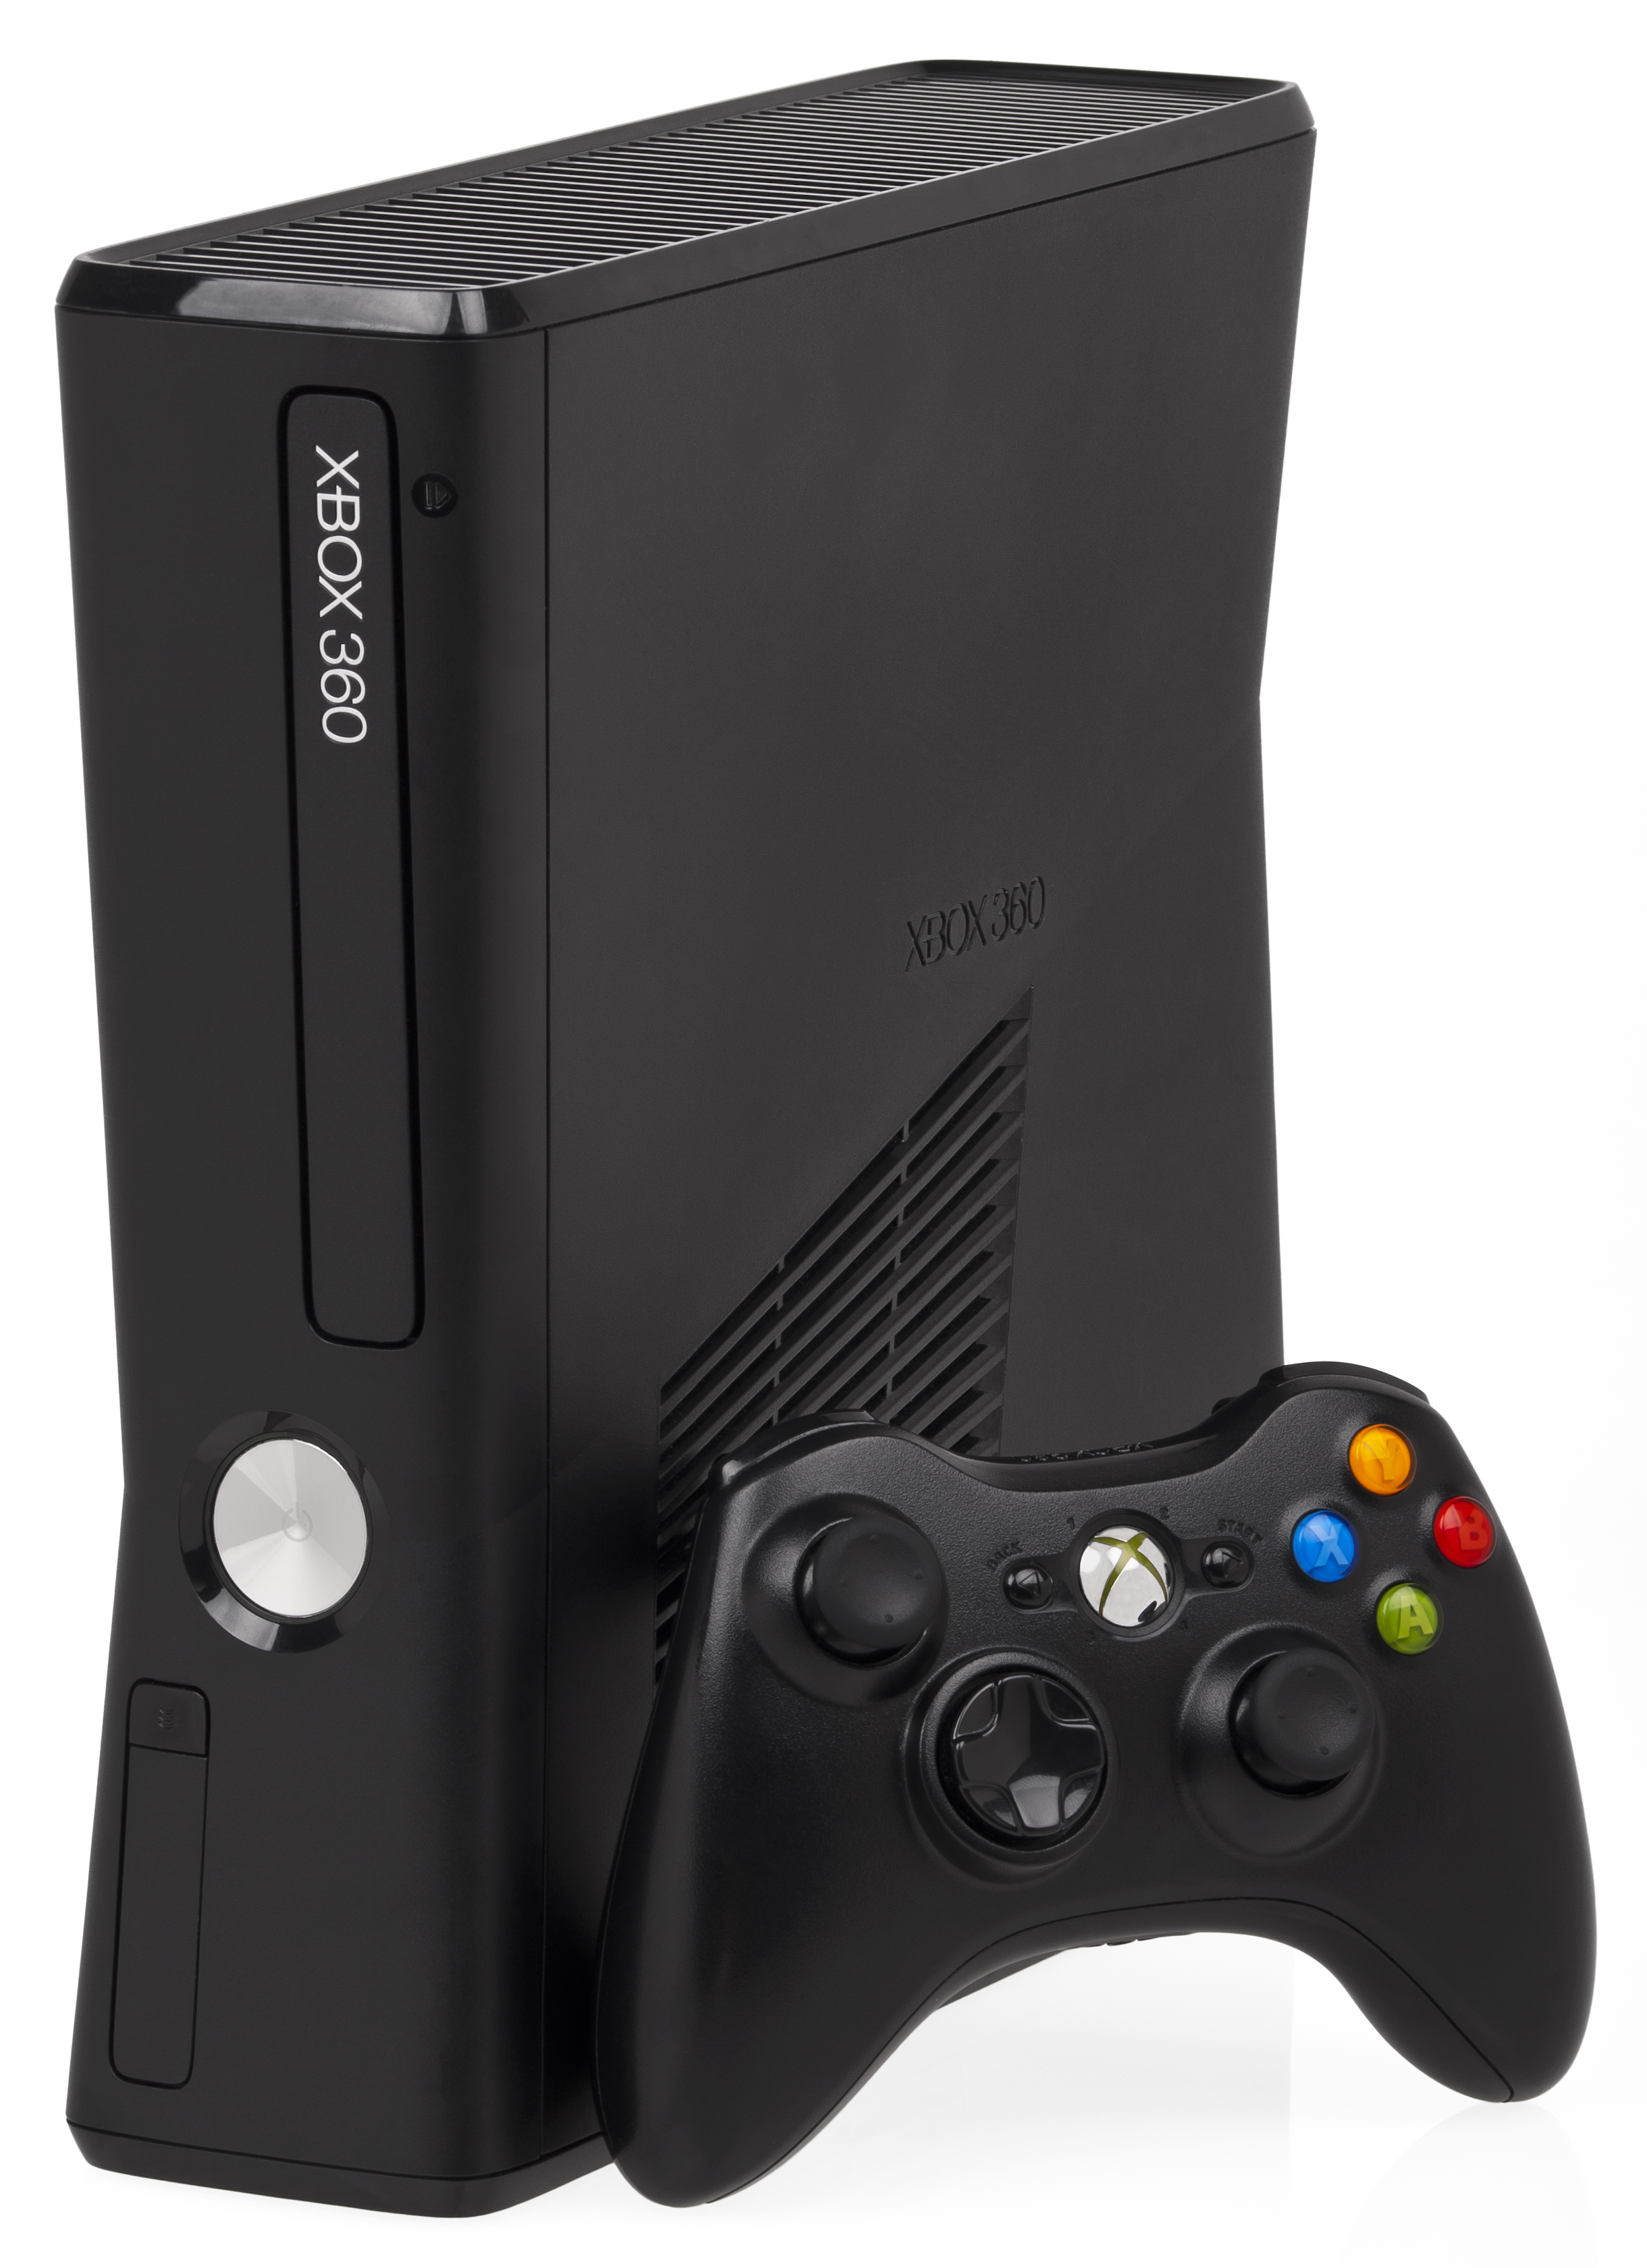
Xbox 360
The console that gave Microsoft its strongest global hardware run thanks to online services, Western software, and early HD.
Read profile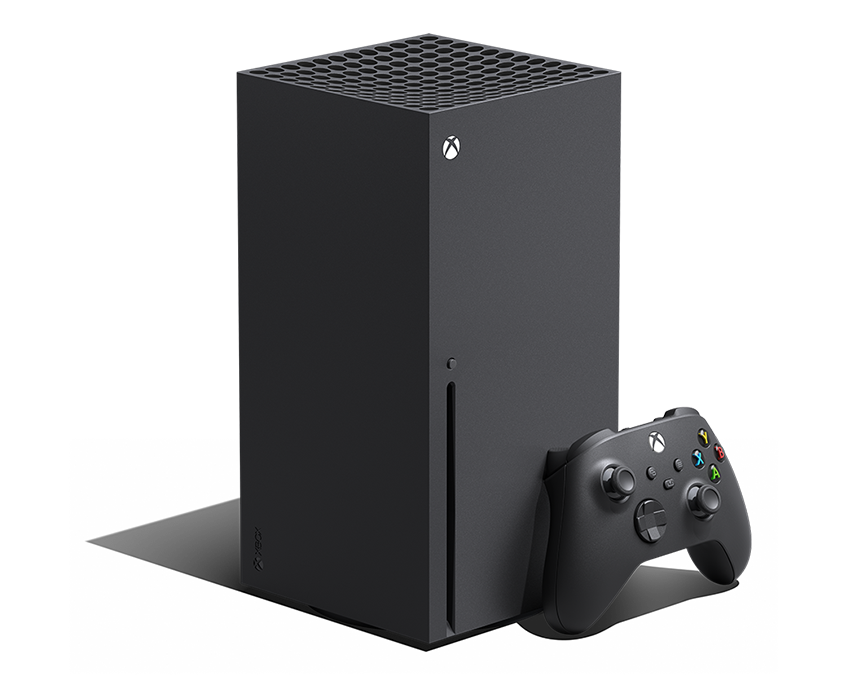
Xbox Series X|S
A current-generation profile where the business story matters as much as the hardware total because the number is estimate-led.
Read profile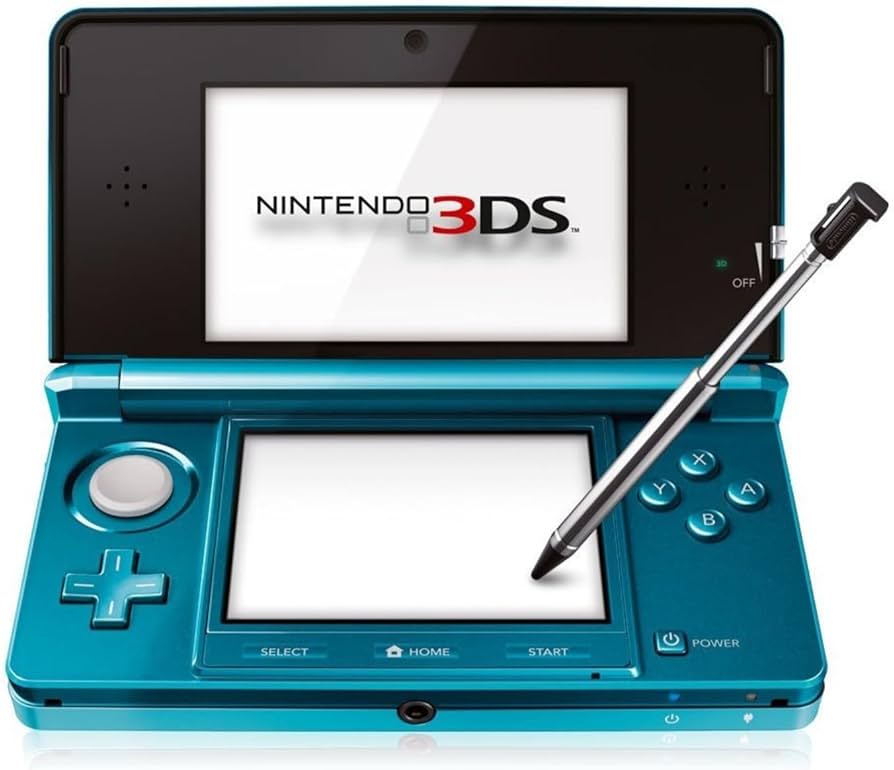
Nintendo 3DS
A launch stumble turned into a long rebound through a price cut, exclusive software, and steady family-market appeal.
Read profile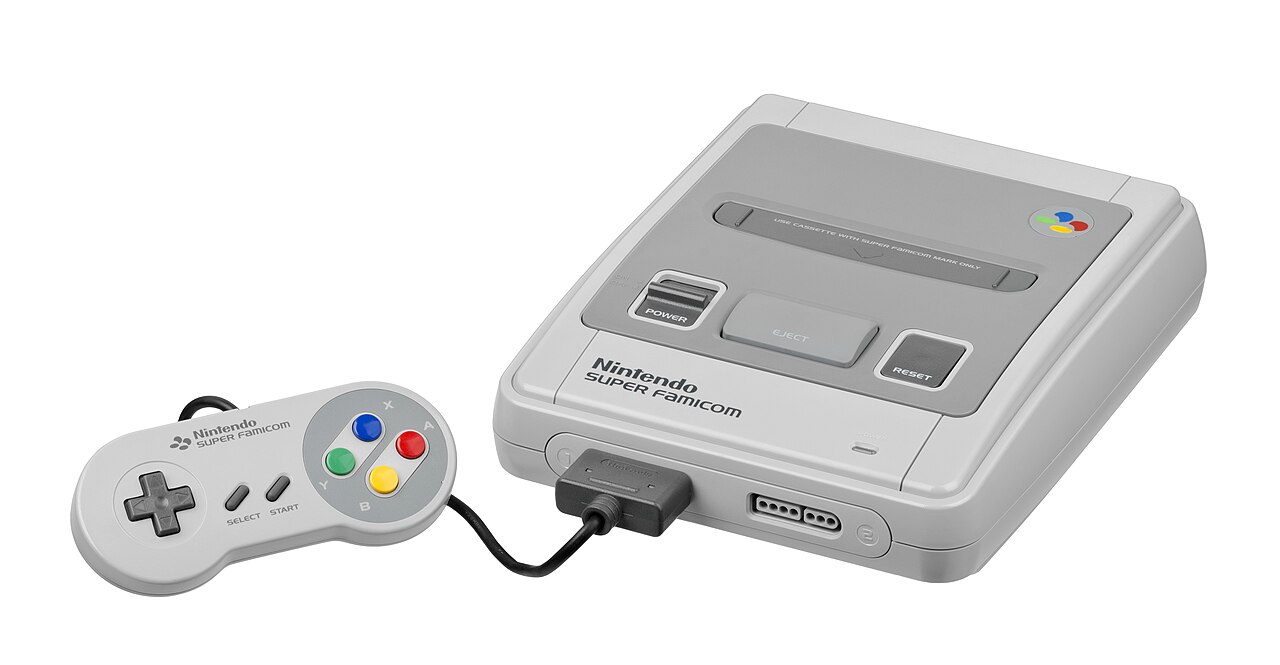
SNES
The Super Nintendo story: software depth, 16-bit rivalry, and how cultural importance can outsize a smaller install base.
Read profileHow to read a console profile
Every profile in this library follows the same editorial grid: the sales story, the context that the headline number hides, the turning points that bent the curve, the games that defined the machine, a competitor snapshot, and a source-confidence note. The repetition is deliberate. When every console answers the same questions, comparing a 1988 cartridge machine with a 2025 hybrid stops being apples versus oranges and becomes a real reading of how each platform earned its total.
The profiles also deliberately separate what a console sold from why it mattered. Dreamcast sits near the bottom of the lifetime table and still gets the same depth of treatment as the PS2, because commercial failure with cultural impact is one of the most interesting stories the numbers can tell.
Four eras, one library
The cartridge era (NES, Master System, Mega Drive, SNES, Game Boy) set the rules: licensed publishing, franchise marketing, and regional rollouts that make some totals harder to pin down today. The disc era (PlayStation, Saturn, Dreamcast, PS2, GameCube, Xbox) shifted the economics toward cheap media and giant catalogs, and produced the all-time leader.
The HD and motion era (Wii, Xbox 360, PS3, then Wii U) split the market between expanded casual audiences and the high-fidelity living room, with very different sales curves on each side. The hybrid and service era (Switch, PS4, PS5, Xbox Series, Switch 2) is where reading totals gets hardest: one vendor stopped reporting units, another merged its home and handheld audiences into a single line. The profiles flag those reading traps on every page where they matter.